
JVM GC 复习(四) - 分析GC Log
上一篇说完GC收集器,这一篇科普一下另一项基本技能,同时也是排查问题的时候经常需要的:分析GC Log。
每个收集器的GC日志可能有所不同,本文以CMS收集器的GC log为例分析。
网上有一篇非常好的GC log分析的文章,也有对应的翻译,这里稍微搬运一下。
一段GC日志
先看一段GC日志:
2016-08-23T02:23:07.219-0200: 64.322: [GC (Allocation Failure) 64.322: [ParNew: 613404K->68068K(613440K), 0.1020465 secs] 10885349K->10880154K(12514816K), 0.1021309 secs] [Times: user=0.78 sys=0.01, real=0.11 secs]
2016-08-23T02:23:07.321-0200: 64.425: [GC (CMS Initial Mark) [1 CMS-initial-mark: 10812086K(11901376K)] 10887844K(12514816K), 0.0001997 secs] [Times: user=0.00 sys=0.00, real=0.00 secs]
2016-08-23T02:23:07.321-0200: 64.425: [CMS-concurrent-mark-start]
2016-08-23T02:23:07.357-0200: 64.460: [CMS-concurrent-mark: 0.035/0.035 secs] [Times: user=0.07 sys=0.00, real=0.03 secs]
2016-08-23T02:23:07.357-0200: 64.460: [CMS-concurrent-preclean-start]
2016-08-23T02:23:07.373-0200: 64.476: [CMS-concurrent-preclean: 0.016/0.016 secs] [Times: user=0.02 sys=0.00, real=0.02 secs]
2016-08-23T02:23:07.373-0200: 64.476: [CMS-concurrent-abortable-preclean-start]
2016-08-23T02:23:08.446-0200: 65.550: [CMS-concurrent-abortable-preclean: 0.167/1.074 secs] [Times: user=0.20 sys=0.00, real=1.07 secs]
2016-08-23T02:23:08.447-0200: 65.550: [GC (CMS Final Remark) [YG occupancy: 387920 K (613440 K)]65.550: [Rescan (parallel) , 0.0085125 secs]65.559: [weak refs processing, 0.0000243 secs]65.559: [class unloading, 0.0013120 secs]65.560: [scrub symbol table, 0.0008345 secs]65.561: [scrub string table, 0.0001759 secs][1 CMS-remark: 10812086K(11901376K)] 11200006K(12514816K), 0.0110730 secs] [Times: user=0.06 sys=0.00, real=0.01 secs]
2016-08-23T02:23:08.458-0200: 65.561: [CMS-concurrent-sweep-start]
2016-08-23T02:23:08.485-0200: 65.588: [CMS-concurrent-sweep: 0.027/0.027 secs] [Times: user=0.03 sys=0.00, real=0.03 secs]
2016-08-23T02:23:08.485-0200: 65.589: [CMS-concurrent-reset-start]
2016-08-23T02:23:08.497-0200: 65.601: [CMS-concurrent-reset: 0.012/0.012 secs] [Times: user=0.01 sys=0.00, real=0.01 secs]
下面逐行分析。
Minor GC
2016-08-23T02:23:07.219-0200: 64.322: [GC (Allocation Failure) 64.322: [ParNew: 613404K->68068K(613440K), 0.1020465 secs] 10885349K->10880154K(12514816K), 0.1021309 secs] [Times: user=0.78 sys=0.01, real=0.11 secs]
- 2016-08-23T02:23:07.219-0200 – GC发生的时间;
- 64.322 – GC开始,相对JVM启动的相对时间,单位是秒;
- GC – 区别MinorGC和FullGC的标识,这次代表的是MinorGC;
- Allocation Failure – MinorGC的原因,在这个case里边,由于年轻代不满足申请的空间,因此触发了MinorGC;
- ParNew – 收集器的名称,它预示了年轻代使用一个并行的 mark-copy stop-the-world 垃圾收集器;
- 613404K->68068K – 收集前后年轻代的使用情况;
- (613440K) – 整个年轻代的容量;
- 0.1020465 secs – 这个解释用原滋原味的解释:Duration for the collection w/o final cleanup.
- 10885349K->10880154K – 收集前后整个堆的使用情况;
- (12514816K) – 整个堆的容量;
- 0.1021309 secs – ParNew收集器标记和复制年轻代活着的对象所花费的时间(包括和老年代通信的开销、对象晋升到老年代时间、垃圾收集周期结束一些最后的清理对象等的花销);
- [Times: user=0.78 sys=0.01, real=0.11 secs] – GC事件在不同维度的耗时,具体的用英文解释起来更加合理:
- user – Total CPU time that was consumed by Garbage Collector threads during this collection
- sys – Time spent in OS calls or waiting for system event
- real – Clock time for which your application was stopped. With Parallel GC this number should be close to (user time + system time) divided by the number of threads used by the Garbage Collector. In this particular case 8 threads were used. Note that due to some activities not being parallelizable, it always exceeds the ratio by a certain amount.
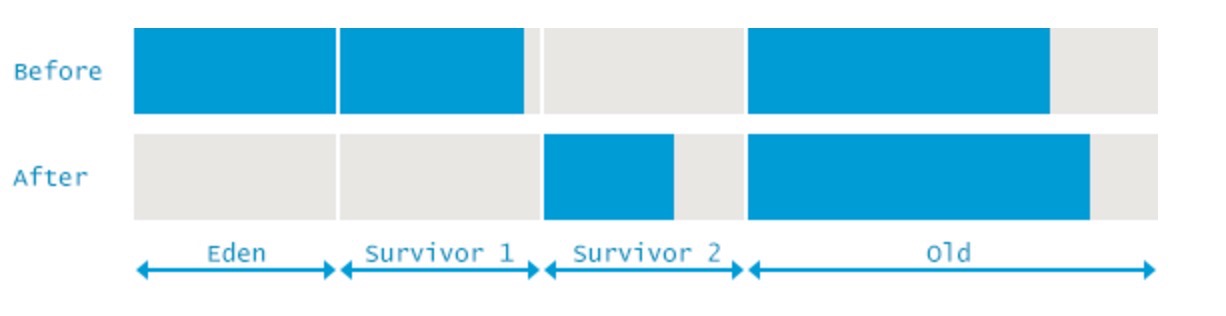
我们来分析下对象晋升问题(原文中的计算方式有问题):
开始的时候:整个堆的大小是 10885349K,年轻代大小是613404K,这说明老年代大小是 10885349-613404=10271945K,
收集完成之后:整个堆的大小是 10880154K,年轻代大小是68068K,这说明老年代大小是 10880154-68068=10812086K,
老年代的大小增加了:10812086-10271945=608209K,也就是说 年轻代到年老代promot了608209K的数据;
如图:
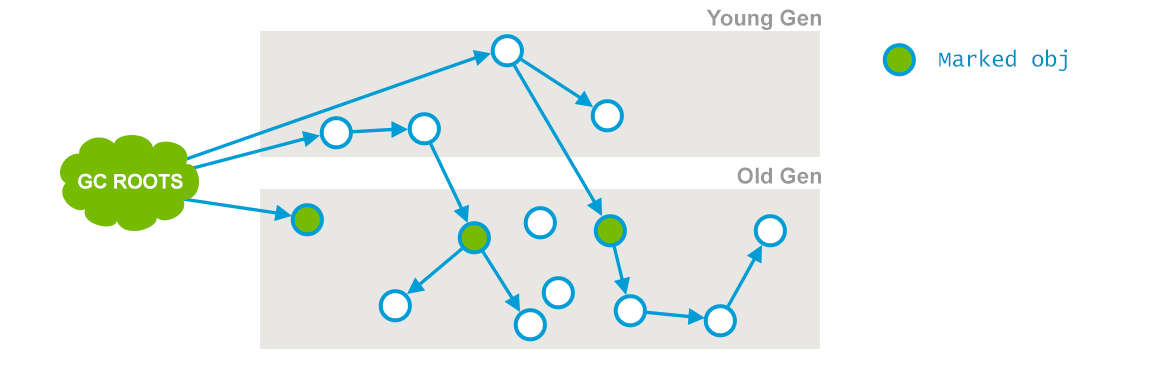
Major GC - Phase 1: Initial Mark
这一步是stop-the-world的,标记root。
对应的log是第2行:
2016-08-23T02:23:07.321-0200: 64.425: [GC (CMS Initial Mark) [1 CMS-initial-mark: 10812086K(11901376K)] 10887844K(12514816K), 0.0001997 secs] [Times: user=0.00 sys=0.00, real=0.00 secs]
- 016-08-23T11:23:07.321-0200: 64.42 – GC事件开始,包括时钟时间和相对JVM启动时候的相对时间,下边所有的阶段改时间的含义相同;
- CMS Initial Mark – 收集阶段,开始收集所有的GC Roots和直接引用到的对象;
- 10812086K – 当前老年代使用情况;
- (11901376K) – 老年代可用容量;
- 10887844K – 当前整个堆的使用情况;
- (12514816K) – 整个堆的容量;
- 0.0001997 secs] [Times: user=0.00 sys=0.00, real=0.00 secs] – 时间计量;
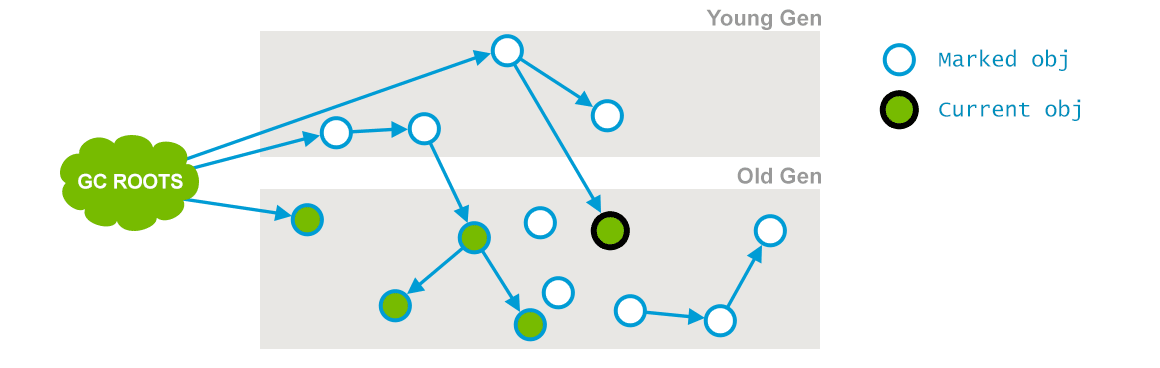
Major GC - Phase 2: Concurrent Mark
这一步是并发mark。
对应的log是3 - 4行:
2016-08-23T02:23:07.321-0200: 64.425: [CMS-concurrent-mark-start] 2016-08-23T02:23:07.357-0200: 64.460: [CMS-concurrent-mark: 0.035/0.035 secs] [Times: user=0.07 sys=0.00, real=0.03 secs]
- CMS-concurrent-mark – 并发收集阶段,这个阶段会遍历整个年老代并且标记活着的对象;
- 035/0.035 secs – 展示该阶段持续的时间和时钟时间;
- [Times: user=0.07 sys=0.00, real=0.03 secs] – 同上
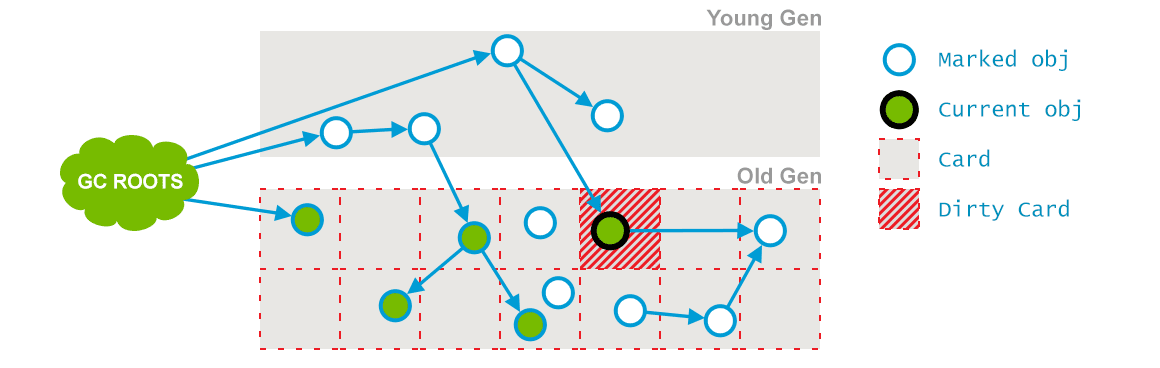
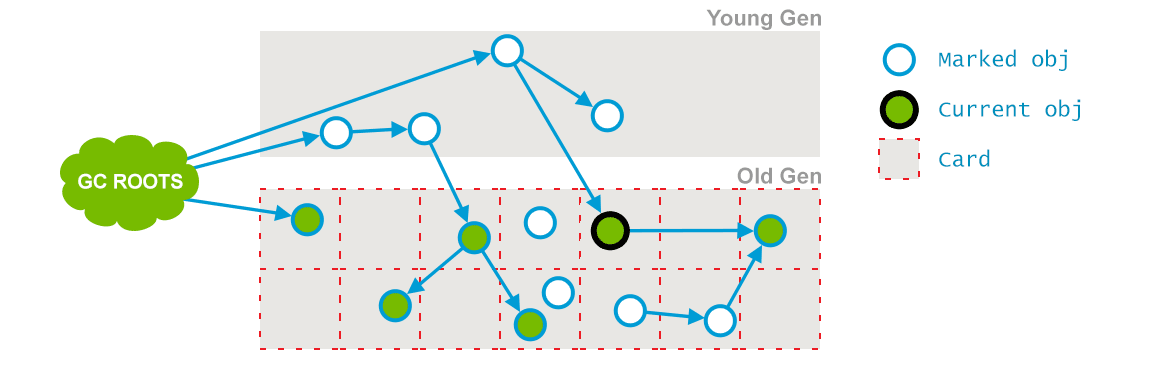
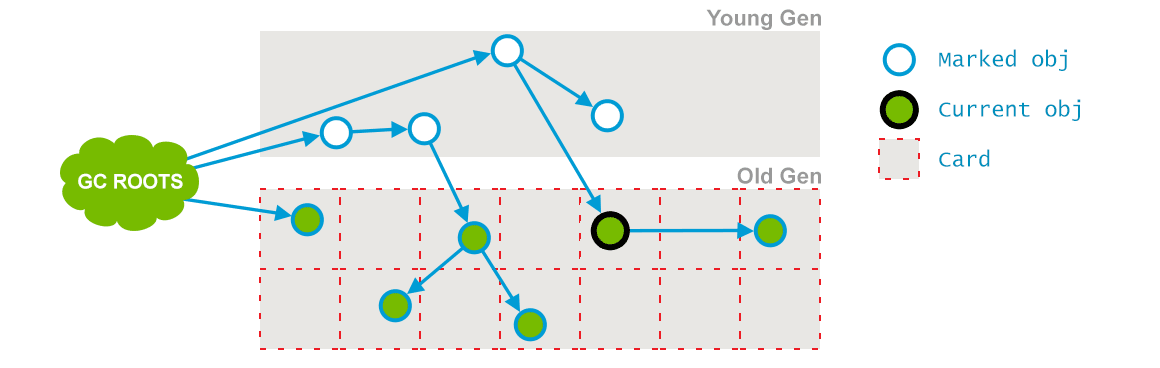
Major GC - Phase 3: Concurrent Preclean
这个阶段又是一个并发阶段,和应用线程并行运行,不会中断他们。前一个阶段在并行运行的时候,一些对象的引用已经发生了变化,当这些引用发生变化的时候,JVM会标记堆的这个区域为Dirty Card(包含被标记但是改变了的对象,被认为”dirty”)
对应的log是5 - 6行:
2016-08-23T02:23:07.357-0200: 64.460: [CMS-concurrent-preclean-start] 2016-08-23T02:23:07.373-0200: 64.476: [CMS-concurrent-preclean: 0.016/0.016 secs] [Times: user=0.02 sys=0.00, real=0.02 secs]
- CMS-concurrent-preclean – 这个阶段负责前一个阶段标记了又发生改变的对象标记;
- 0.016/0.016 secs – 展示该阶段持续的时间和时钟时间;
- [Times: user=0.02 sys=0.00, real=0.02 secs] – 同上
Major GC - Phase 4: Concurrent Abortable Preclean
这一阶段是为了减轻final remark阶段的stw时间。这一步是并发进行的。
对应的log是7 - 8行:
2016-08-23T11:23:07.373-0200: 64.476: [CMS-concurrent-abortable-preclean-start] 2016-08-23T11:23:08.446-0200: 65.550: [CMS-concurrent-abortable-preclean: 0.167/1.074 secs] [Times: user=0.20 sys=0.00, real=1.07 secs]
- CMS-concurrent-abortable-preclean – 可终止的并发预清理;
- 0.167/1.074 secs – 展示该阶段持续的时间和时钟时间(It is interesting to note that the user time reported is a lot smaller than clock time. Usually we have seen that real time is less than user time, meaning that some work was done in parallel and so elapsed clock time is less than used CPU time. Here we have a little amount of work – for 0.167 seconds of CPU time, and garbage collector threads were doing a lot of waiting. Essentially, they were trying to stave off for as long as possible before having to do an STW pause. By default, this phase may last for up to 5 seconds);
- [Times: user=0.20 sys=0.00, real=1.07 secs] – 同上
Major GC - Phase 5: Final Remark
这一步是最后的标记,标记出所有的live objects。这一步是最后一个stop-the-world的阶段。
对应的log是第9行:
2016-08-23T02:23:08.447-0200: 65.550: [GC (CMS Final Remark) [YG occupancy: 387920 K (613440 K)]65.550: [Rescan (parallel) , 0.0085125 secs]65.559: [weak refs processing, 0.0000243 secs]65.559: [class unloading, 0.0013120 secs]65.560: [scrub symbol table, 0.0008345 secs]65.561: [scrub string table, 0.0001759 secs][1 CMS-remark: 10812086K(11901376K)] 11200006K(12514816K), 0.0110730 secs] [Times: user=0.06 sys=0.00, real=0.01 secs]
- 2016-08-23T11:23:08.447-0200: 65.550 – 同上;
- CMS Final Remark – 收集阶段,这个阶段会标记老年代全部的存活对象,包括那些在并发标记阶段更改的或者新创建的引用对象;
- YG occupancy: 387920 K (613440 K) – 年轻代当前占用情况和容量;
- [Rescan (parallel) , 0.0085125 secs] – 这个阶段在应用停止的阶段完成存活对象的标记工作;
- weak refs processing, 0.0000243 secs]65.559 – 第一个子阶段,随着这个阶段的进行处理弱引用;
- class unloading, 0.0013120 secs]65.560 – 第二个子阶段(that is unloading the unused classes, with the duration and timestamp of the phase);
- scrub string table, 0.0001759 secs – 最后一个子阶段(that is cleaning up symbol and string tables which hold class-level metadata and internalized string respectively)
- 10812086K(11901376K) – 在这个阶段之后老年代占有的内存大小和老年代的容量;
- 11200006K(12514816K) – 在这个阶段之后整个堆的内存大小和整个堆的容量;
- 0.0110730 secs – 这个阶段的持续时间;
- [Times: user=0.06 sys=0.00, real=0.01 secs] – 同上;
Major GC - Phase 6: Concurrent Sweep
清扫dead objects。不需要stop-the-world的。
对应的log是10 - 11行:
2016-08-23T02:23:08.458-0200: 65.561: [CMS-concurrent-sweep-start] 2016-08-23T02:23:08.485-0200: 65.588: [CMS-concurrent-sweep: 0.027/0.027 secs] [Times: user=0.03 sys=0.00, real=0.03 secs]
- CMS-concurrent-sweep – 这个阶段主要是清除那些没有标记的对象并且回收空间;
- 0.027/0.027 secs – 展示该阶段持续的时间和时钟时间;
- [Times: user=0.03 sys=0.00, real=0.03 secs] – 同上
Major GC - Phase 7: Concurrent Reset
这一步是做一些收尾工作,回收CMS内部的数据结构,准备下一个CMS生命周期的使用。
2016-08-23T11:23:08.485-0200: 65.589: [CMS-concurrent-reset-start] 2016-08-23T11:23:08.497-0200: 65.601: [CMS-concurrent-reset: 0.012/0.012 secs] [[Times: user=0.01 sys=0.00, real=0.01 secs]
- CMS-concurrent-reset – 这个阶段重新设置CMS算法内部的数据结构,为下一个收集阶段做准备;
- 0.012/0.012 secs – 展示该阶段持续的时间和时钟时间;
- [Times: user=0.01 sys=0.00, real=0.01 secs] – 同上
参考
- https://plumbr.eu/handbook/garbage-collection-algorithms-implementations#parallel-minor-gc
- http://www.cnblogs.com/zhangxiaoguang/p/5792468.html